Assignment files
Solutions
Developed by Lion Behrens, Duco Veen and Rens van de Schoot
This tutorial is based on Veen, Stoel, Zondervan-Zwijnenburg & van de Schoot (2017) and provides the reader with a basic introduction to specifying prior distributions based on eliciting expert knowledge using an original Shiny app. The reader will be guided through a five-step method with which experts from academia, business, society or other fields can express their beliefs and predictions in the form of a probability distribution. Open the application to perform the exercise!
Introduction
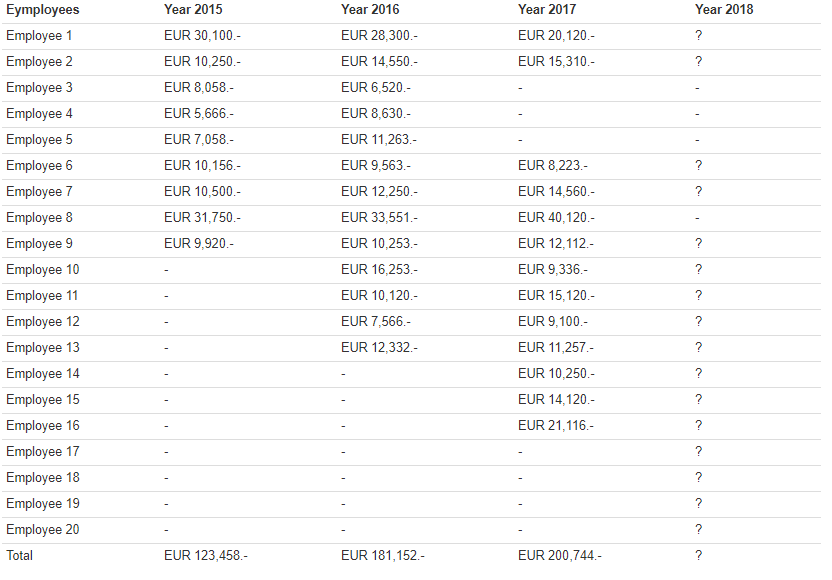
DataAid is a young start-up company founded in 2015 consisting of a network of young data analysists and programmers. Table 1 displays the generated turnover per year for each employee since the company’s founding in 2015. DataAid started out with nine employees. Over the years, four employees dropped out, while new ones joined. All cells filled with a question mark represent employees that will work for the company in 2018.
Table 1: Individual and Overall Turnover Rates
Exercise
Open the Shiny app. Consider yourself an expert whose knowledge should be elicited. Your task is to predict the turnover rate created by the company for the upcoming year 2018 based on the prior knowledge that you required by inspecting Table 1.
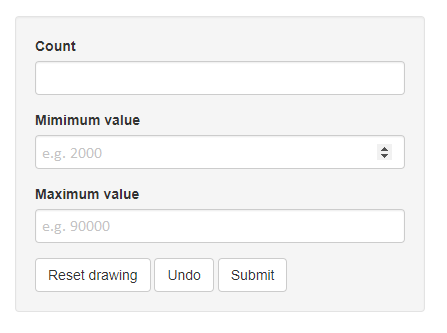
a) Start by defining the number of employees that will create individual turnover rates for the company in 2018. Fill in this number under “Count”.
b) Consider all individual turnover rates by the employees that will be active in 2018. What is the minimum turnover rate that you expect? Fill in this number under “Minimum Value”. What is the maximum turnover rate that you expect? Fill in this number under “Maximum Value”.
c) The figure on the upper right is showing the scale of individual turnover rates that you defined. Below, your expected turnover rates for the least productive employee (“Minimum”) and the most productive employee (“Maximum”) are displayed as black dots.
How will the remaining employees perform on this scale? Add one dot for every additional employee so that the overall number of dots matches your value in “Count”. Once you filled in all your expectations the figure on the top right shows how your input in interpreted. The figure shows a probability distribution for the individual turnover rates. The higher the density of the distribution is at a certain value, the more plausible it is that this turnover occurs. If you feel that this distribution is a correct representation of your beliefs you can confirm this by pressing the “submit” button. If the distribution does not match you beliefs, please adjust your input by using either the “undo” or “reset drawing” button and replacing the dots until the dixstribution in the top right matches your beliefs. Only when the distribution matches your beliefs you should press the “submit” button.
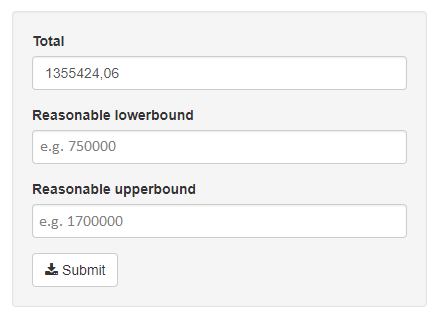
d) Based on your entries, a distribution for individual turnover rates has now been formed in the upper figure. Ultimately, you are interested in the company’s total turnover for the year 2018 though. In the top line, click on “Elicitation Scale & Shape Parameters”. Under “Total”, you see the company’s total turnover that you expect based on your individual entries. Reflecting on the company’s performance of earlier years again, what would be the minimum total turnover rate that you expect for 2018? Fill in this number under “Reasonable lowerbound”. What would be the maximum? Fill in this number under “Reasonable upperbound”.
Inspect the figure on the right. You have now quantified and visualized your expectation about the company’s total turnover in 2018 based on your prior knowledge of recent years’ performances. If you do not agree with this representation of your beliefs, please adjust your input for either the total, lower or upper bound.
Result: The distribution as a whole displays all values you expect to be possible. It finds its maximum at the value you deem most likely. The width of the distribution expresses your uncertainty about this value. You can use this result as a prior distribution for subsequent statistical analyses. Also, you can treat it as an expert’s prediction about DataAid’s economic performance in the upcoming year. Click “Submit” to receive information of this distribution such as its mean or standard deviation.
References
Veen, D., Stoel, D., Zondervan-Zwijnenburg, M., van de Schoot, R. (2017) A Five-Step Method to Elicit Expert Judgement. Manuscript submitted for publication.
Other tutorials you might be interested in
First Bayesian Inference
-----------------------------------------------------------
The WAMBS-Checklist
MPLUS: How to avoid and when to worry about the misuse of Bayesian Statistics
RJAGS: How to avoid and when to worry about the misues of Bayesian Statistics
Blavaan: How to avoid and when to worry about the misuse of Bayesian Statistics


